Every sport, every single one, has one thing in common — doing math. The simple act of keeping score is simple math, and in every sporting event, there is a score. Of course, many other mathematical equations make up sports calculations beyond scoring. Percentages. Averages. Totals. Comparisons. Statistical collection is the very backbone of all athletic contests and fodder for all sporty pundits to make their cases for the reasons behind winning and losing.
In “We Do the Math,” we’ll look at some unique numbers beyond scores and common statistics that give you new numeric ways to look at Hope sports. You just may find that, as American mathematician and Field Medal winner William Paul Thurston said, “mathematics is not about numbers, equations, computations or algorithms; it’s about understanding.”
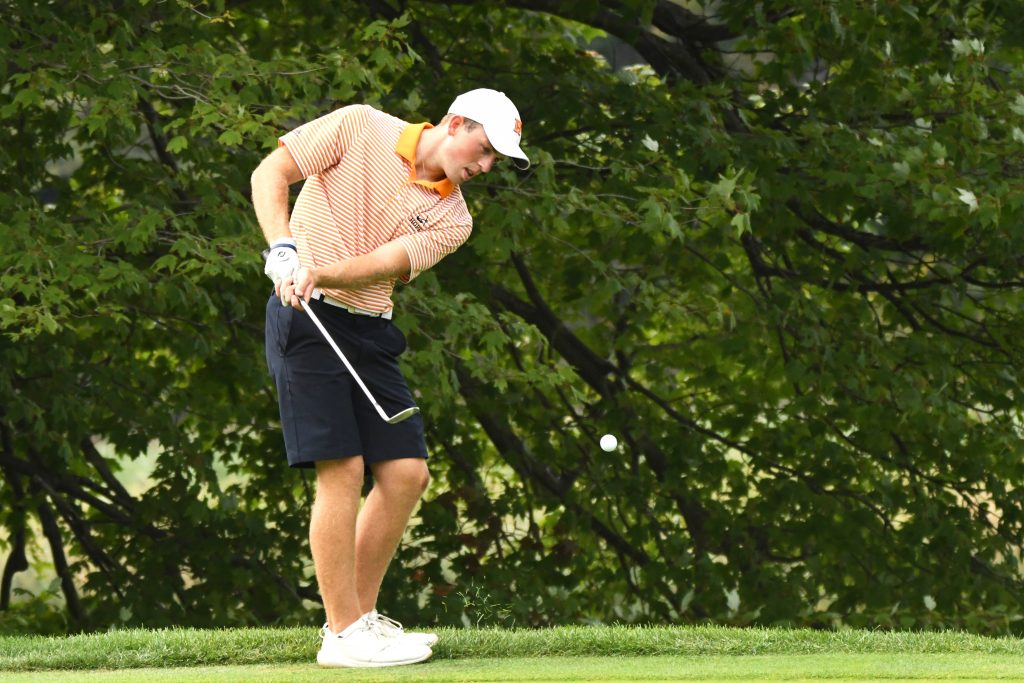
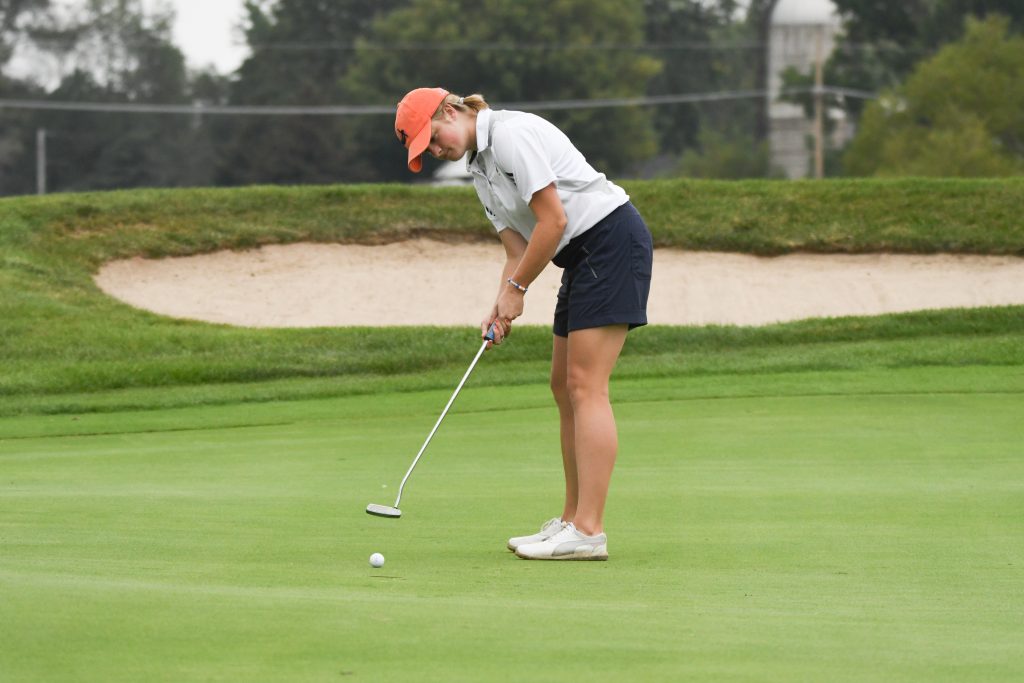
Up first, Hope College men’s and women’s golf, both runners up in the MIAA in 2019. Here are some idiosyncratic ways that the teams’ six-week fall season (they also play for another five weeks in the spring) added up.

| Men’s Golf | Women’s Golf |
| 11 – Number of contests | 11 – Number of contests |
| 198 – Total holes played/golfer | 198 – Total holes played/golfer |
| 1,188 – Total holes played as a team | 1,188 – Total holes played as a team |
| 73,443 – Total yards played/golfer | 63,925 – Total yards played/golfer |
| 41.73 – Miles walked/golfer | 36.32 – Miles walked/golfer |
| 250.38 – Total miles walked as a team | 217.92 – Total miles walked as a team |
| 1,798.9 – Total van miles driven by Coach Scott Lokers ’81 | 1,564.4 – Total van miles driven by Coach Greg Stafford |


